Dissecting
Heritability & Causal Variance in Cancer Genomics
Learn more

Intro


Our Goal

Our goal is to shed light on the genetic architecture of cancers by enhancing comprehension of their heritability and polygenic characteristics.
Understanding these genetic influences will better help us understand the relationship between evolution and genes which can contribute to these common cancers.


Our Hypothesis

As the number of causal SNPs increases for a gene ID, the higher its heritability is likely to be, aligning with the assumption in existing literature that gene IDs or traits with few causal variants are often not highly conserved.


Github Link Report Link

Methods


We used a variety of tools and languages throughout the many components of our project, including R, RStudio, Plink, Python, and GCTA (Genome-wide Complex Trait Analysis) command line tool to name a few.
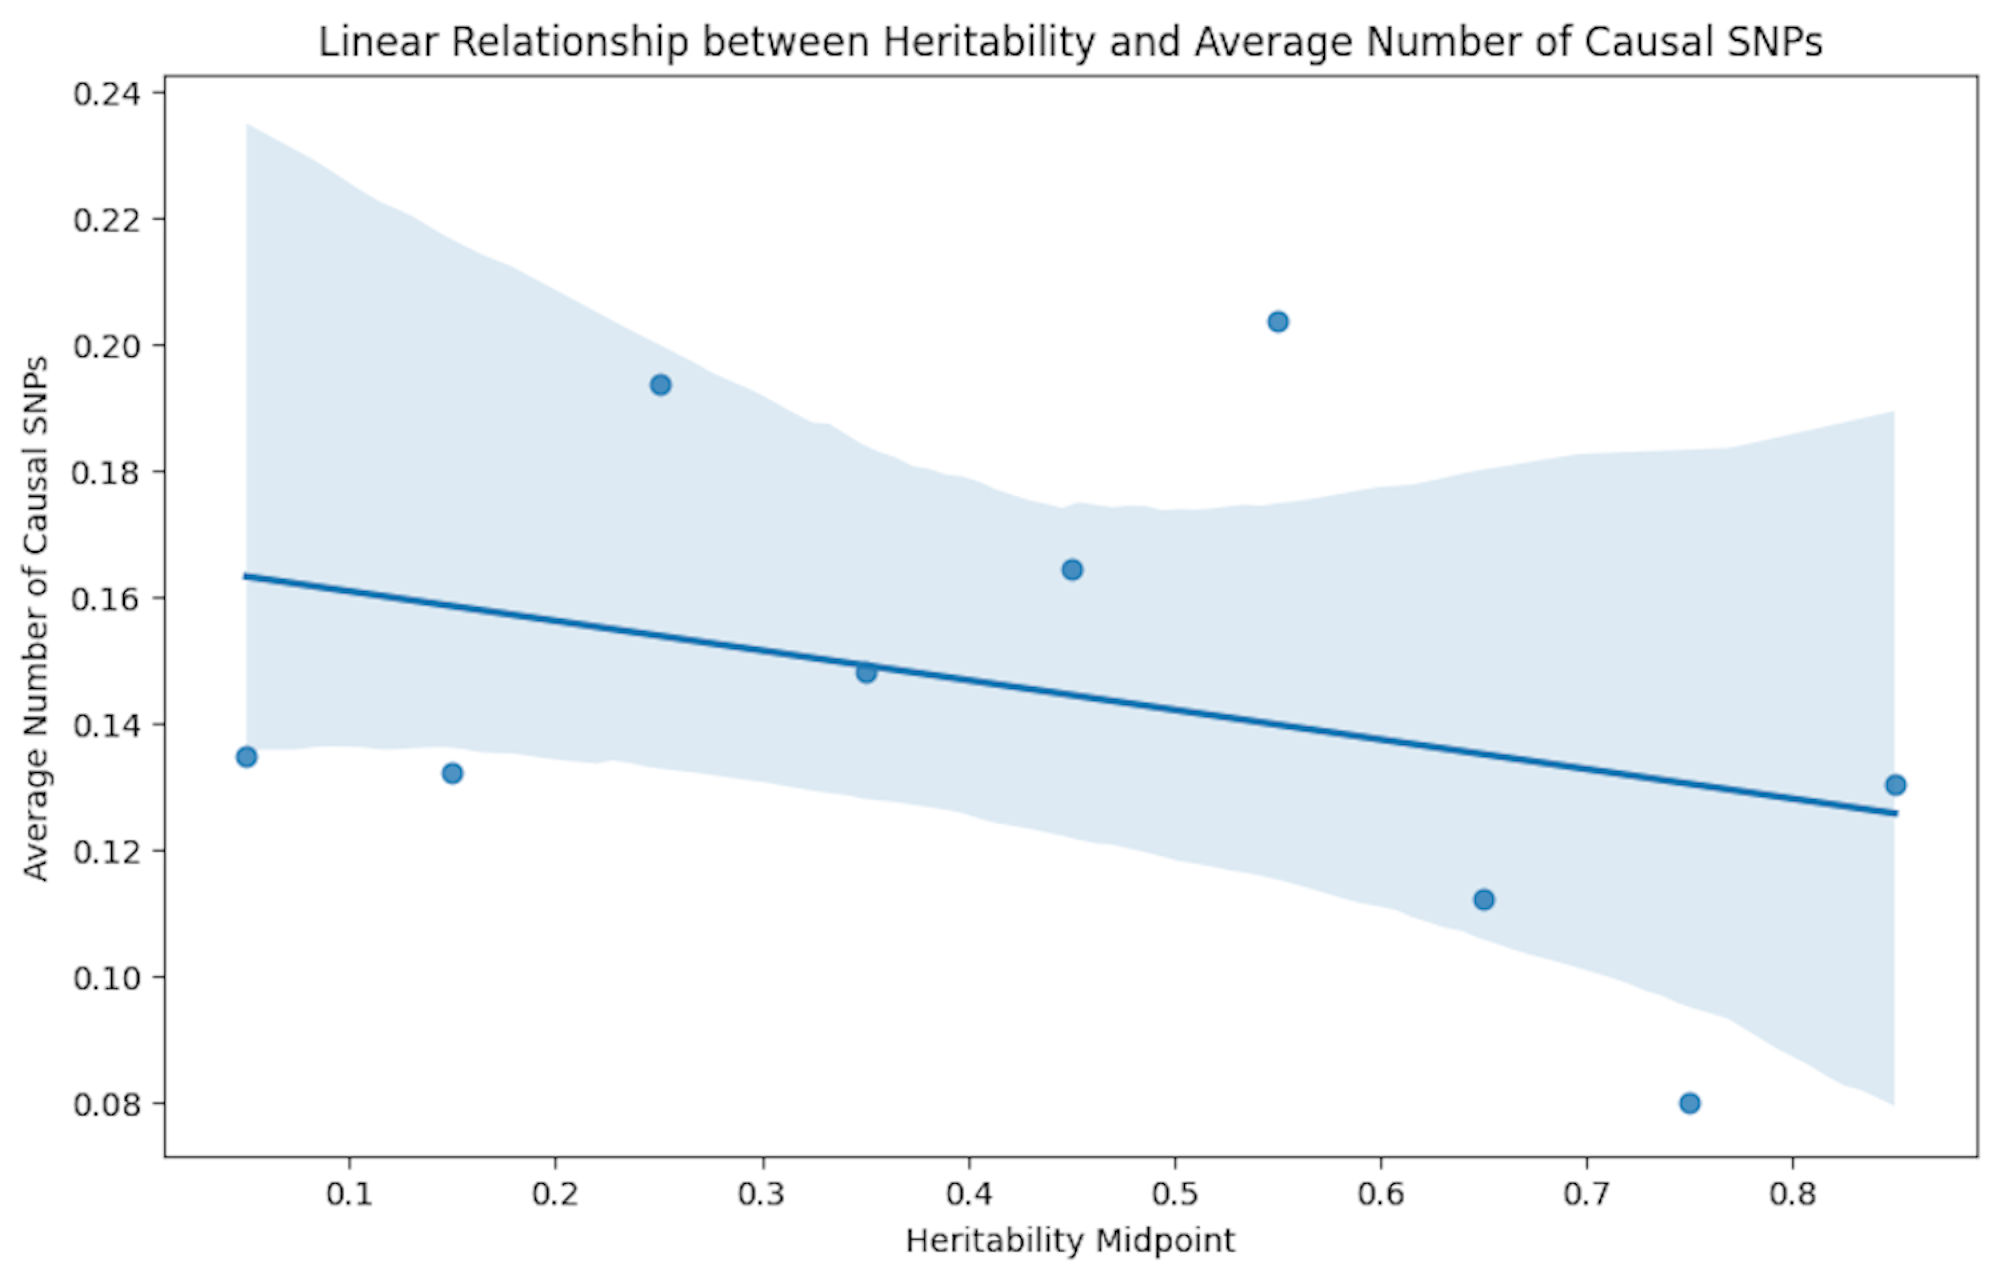


Regression

Illustrating the direct relationship between the causal variance and heritability.


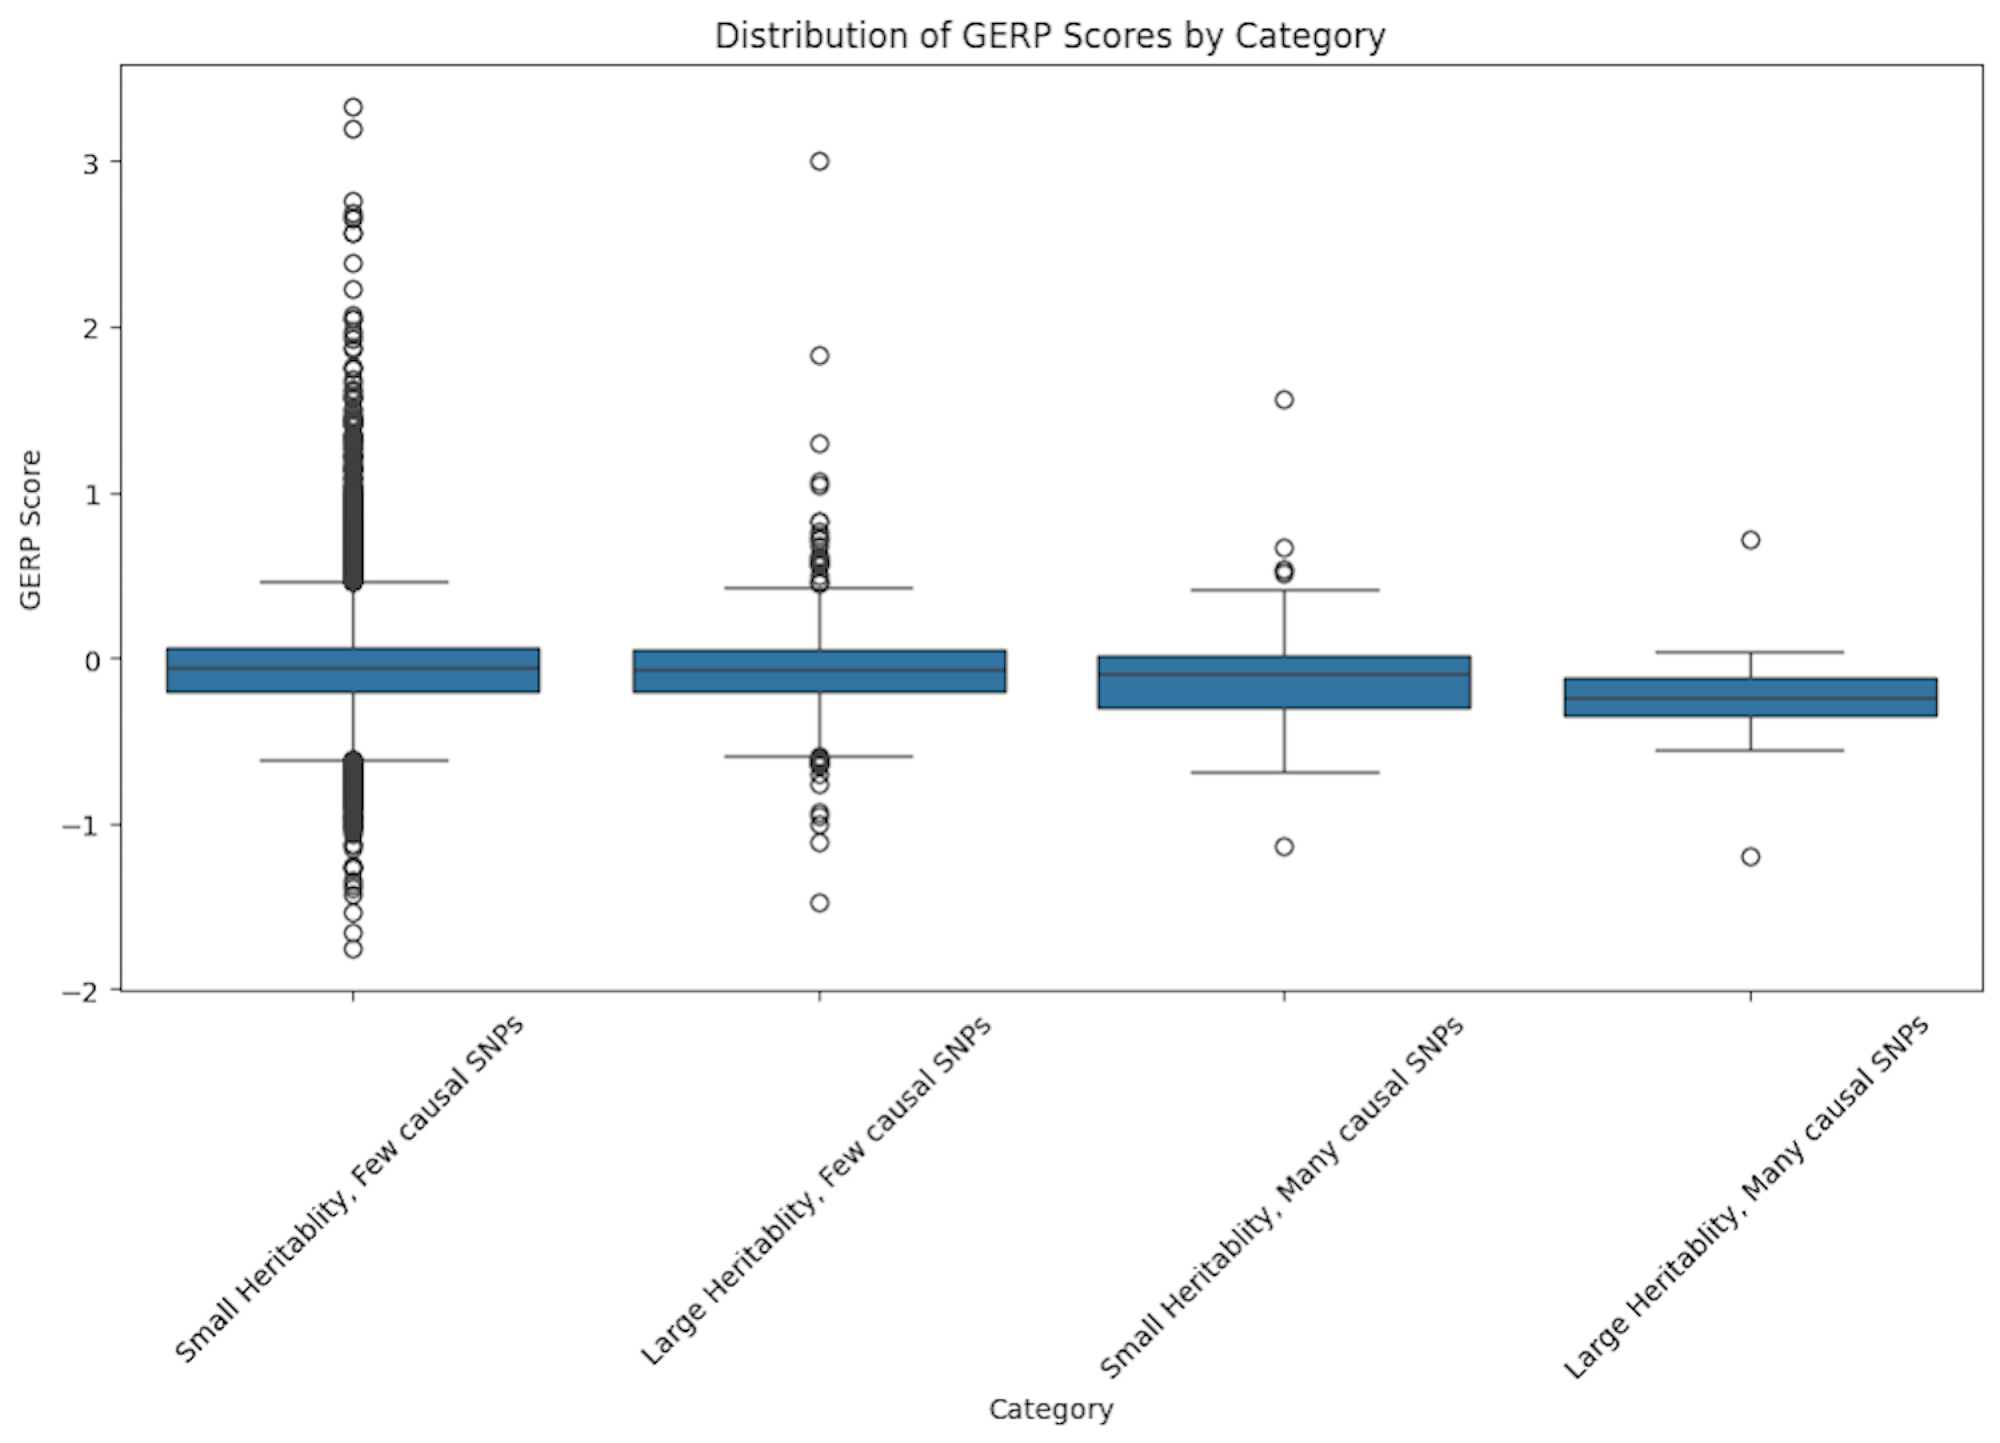
Genomic Evolutionary Rate Profiling (GERP)

The GERP score analysis offered additional evolutionary insight.


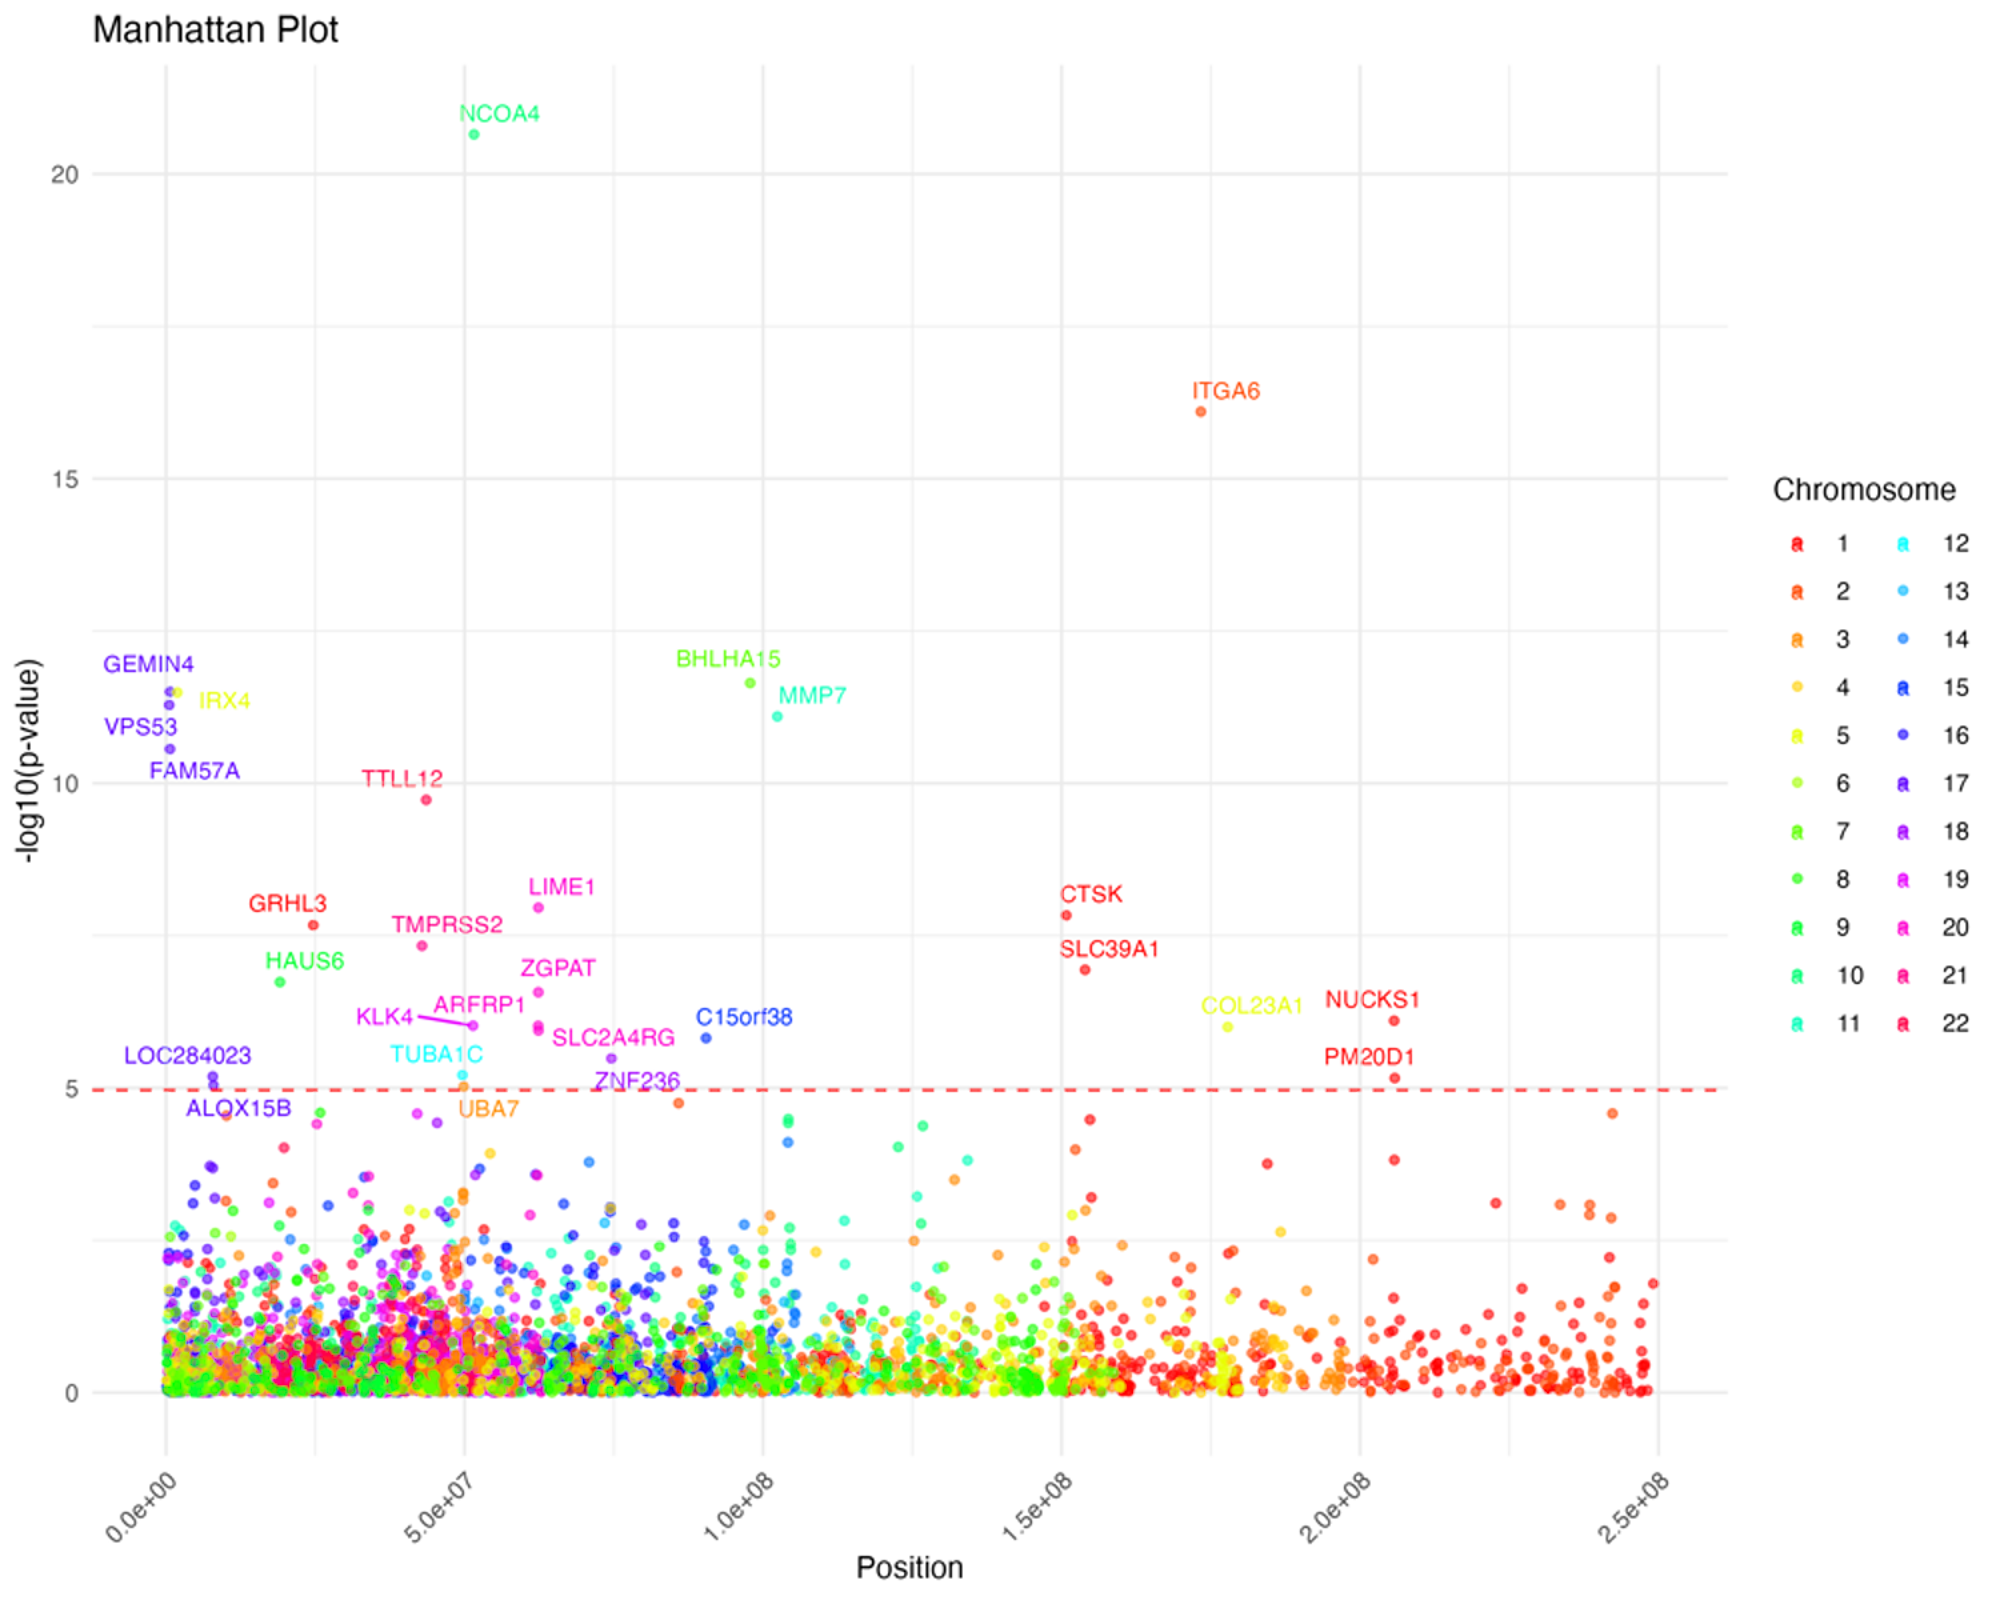
Transcriptome-Wide Association Study (TWAS)

The TWAS analysis is focused on cancer traits with high heritability and low causal variance to identify relevant gene IDs.


6 Models

TOP1 (Single best eQTL)
The Sum of Single Effects (SuSiE) Fine mapping results
Bayesian Sparse Linear Mixed Model (BSLMM)
Elastic net regression
Least Absolute Shrinkage and Selection Operator (LASSO)

Best linear unbiased predictor (BLUP)
Note: This model was excluded from the results due to convergence issues

Findings

Causal Variance vs. Heritability

As the number of causal SNPs increases per gene ID, its heritability on average increases. This contradicts our hypothesis. A potential reason this occurs is that as the number of causal SNPs increases per gene ID, then it is likely that the particular gene ID has more factors that determine its occurrence, which could also make it more difficult for that gene ID to be consistently heritable.

missing
missing

Genomic Evolutionary Rate Profiling Analysis

The GERP score was calculated for each gene ID in the region 500 KB from its start and stop positions. The scores were normally distributed around 0. The range of the score is from -1 to 1, with 1 meaning highly conserved. Gene IDs with small heritability and most causal SNPs had the most variation within their scores, although there are also significantly more genes in this category versus the others.

Transcription Wide Association Study Analysis for Cancers

TWAS allows us to correlate the gene expression data with trait variations, meaning we can identify the specific gene IDs whose expression is significantly correlated to diseases. This is particularly effective in cancers since it is caused by a small number of mutations. We applied this technique to identify causal SNPs in Breast Invasive Carcinoma, Ovarian Serous Cystadenocarcinoma, Prostate Adenocarcinoma, and Skin Cutaneous Melanoma.

missing

Further details and findings are included in our Report

Interactive App


External Link for App

Our Team


Team member

Gurman Dhaliwal

Researcher
gdhaliwa@ucsd.edu

Team member

Lihao Liu

Researcher
liliu@ucsd.edu

Team member

Anton Beliakov

Researcher
abeliako@ucsd.edu

Team member

Dr. Amariuta

Mentor
tamariutabartell@ucsd.edu